Finanzberichte & Bilanzen
Komplexe Tabellen in Excel konvertieren
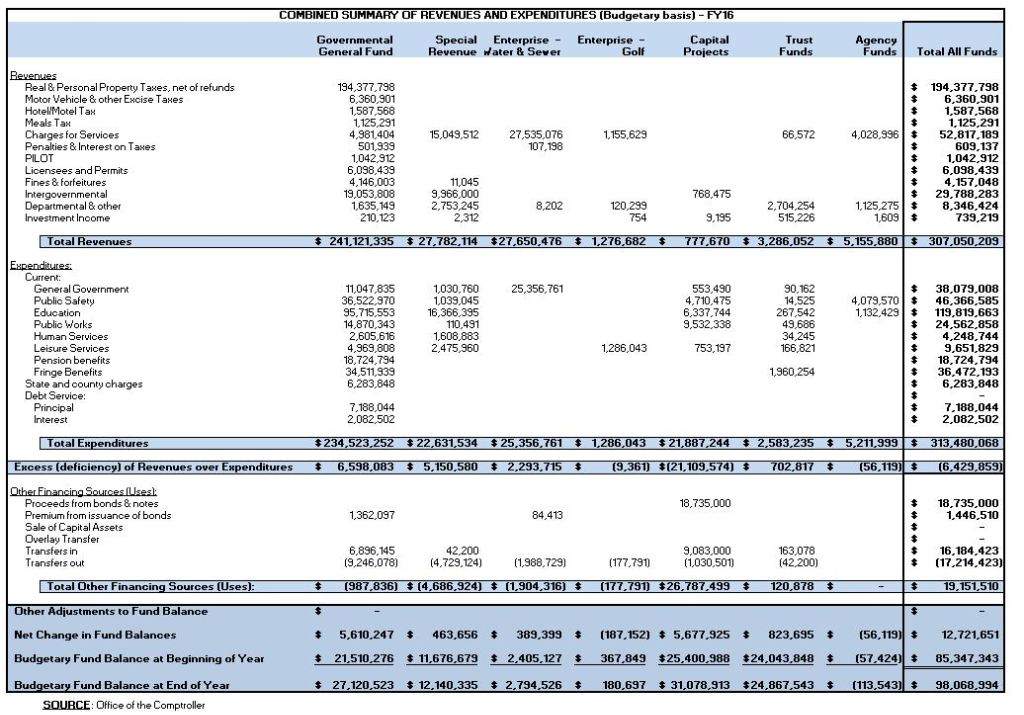
Extrahiere dichte Finanzberichte, Bilanzen und komplexe Tabellen in strukturierte, bearbeitbare Tabellenkalkulationen unter Beibehaltung der Zeilen- und Spaltenbeziehungen.
- Dichte Finanzzahlen und Währungsdaten
- Komplexe Kopfzeilen und mehrspaltige Layouts
- Gemischte Zeilenstrukturen und hervorgehobene Summen
Quellbild (JPG/PNG)
100%
Bearbeitbare Tabelle (.xlsx)
| A | B | C | D | E | F | G | H | I | |
|---|---|---|---|---|---|---|---|---|---|
| 1 | COMBINED SUMMARY OF REVENUES AND EXPENDITURES (Budgetary basis) - FY16 | ||||||||
| 2 | Governmental General Fund | Special Revenue | Enterprise – Water & Sewer | Enterprise – Golf | Capital Projects | Trust Funds | Agency Funds | Total All Funds | |
| 3 | Revenues | ||||||||
| 4 | Real & Personal Property Taxes, net of refunds | 194,377,798 | $ 194,377,798 | ||||||
| 5 | Motor Vehicle & other Excise Taxes | 6,360,901 | $ 6,360,901 | ||||||
| 6 | Hotel/Motel Tax | 1,587,568 | $ 1,587,568 | ||||||
| 7 | Meals Tax | 1,125,291 | $ 1,125,291 | ||||||
| 8 | Charges for Services | 4,981,404 | 15,049,512 | 27,535,076 | 1,155,629 | 66,572 | 4,028,996 | $ 52,817,189 | |
| 9 | Penalties & Interest on Taxes | 501,939 | 107,198 | $ 609,137 | |||||
| 10 | PILOT | 1,042,912 | $ 1,042,912 | ||||||
| 11 | Licenses and Permits | 6,098,439 | $ 6,098,439 | ||||||
| 12 | Fines & forfeitures | 4,146,003 | 11,045 | $ 4,157,048 | |||||
| 13 | Intergovernmental | 19,053,808 | 9,966,000 | 768,475 | $ 29,788,283 | ||||
| 14 | Departmental & other | 1,635,149 | 2,753,245 | 8,202 | 120,299 | 2,704,254 | 1,125,275 | $ 8,346,424 | |
| 15 | Investment Income | 210,123 | 2,312 | 754 | 9,195 | 515,226 | 1,609 | $ 739,219 | |
| 16 | Total Revenues | $ 241,121,335 | $ 27,782,114 | $ 27,650,476 | $ 1,276,682 | $ 777,670 | $ 3,286,052 | $ 5,155,880 | $ 307,050,209 |
| 17 | Expenditures: | ||||||||
| 18 | Current: | ||||||||
| 19 | General Government | - | 1,030,760 | 25,356,761 | 553,490 | 90,162 | $ 38,079,008 | ||
| 20 | Public Safety | 36,522,970 | 1,039,045 | 4,710,475 | 14,525 | 4,079,570 | $ 46,366,585 | ||
| 21 | Education | 95,715,553 | 16,366,395 | 6,337,744 | 267,542 | 1,132,429 | $ 119,819,663 | ||
| 22 | Public Works | 14,870,343 | 110,491 | 9,532,338 | 49,686 | $ 24,562,858 | |||
| 23 | Human Services | 2,605,616 | 1,608,883 | 34,245 | $ 4,248,744 | ||||
| 24 | Leisure Services | 4,968,808 | 2,475,960 | 1,286,043 | 753,197 | 166,821 | $ 9,651,829 | ||
| 25 | Pension benefits | 18,724,794 | $ 18,724,794 | ||||||
| 26 | Fringe Benefits | 34,511,939 | 1,960,254 | $ 36,472,193 | |||||
| 27 | State and county charges | 6,283,848 | $ 6,283,848 | ||||||
| 28 | Debt Service: | ||||||||
| 29 | Principal | 7,188,044 | $ 7,188,044 | ||||||
| 30 | Interest | 2,082,502 | $ 2,082,502 | ||||||
| 31 | Total Expenditures | $ 234,523,252 | $ 22,631,534 | $ 25,356,761 | $ 1,286,043 | $ 21,887,244 | $ 2,583,235 | $ 5,211,999 | $ 313,480,068 |
| 32 | Excess (deficiency) of Revenues over Expenditures | $ 6,598,083 | $ 5,150,580 | $ 2,293,715 | $ (9,361) | $ (21,109,574) | $ 702,817 | $ (56,119) | $ (6,429,859) |
| 33 | Other Financing Sources (Uses): | ||||||||
| 34 | Proceeds from bonds & notes | 18,735,000 | $ 18,735,000 | ||||||
| 35 | Premium from issuance of bonds | 1,362,097 | 84,413 | $ 1,446,510 | |||||
| 36 | Sale of Capital Assets | $ – | |||||||
| 37 | Overlay Transfer | $ – | |||||||
| 38 | Transfers in | 6,896,145 | 42,200 | 9,083,000 | 163,078 | $ 16,184,423 | |||
| 39 | Transfers out | (9,246,078) | (4,729,124) | (1,988,729) | (177,791) | (1,030,501) | (42,200) | $ (17,214,423) | |
| 40 | Total Other Financing Sources (Uses): | $ (987,836) | $ (4,686,924) | $ (1,904,316) | $ (177,791) | $ 26,787,499 | $ 120,878 | $ – | $ 19,151,510 |
| 41 | Other Adjustments to Fund Balance | $ – | $ – | ||||||
| 42 | Net Change in Fund Balances | $ 5,610,247 | $ 463,656 | $ 389,399 | $ (187,152) | $ 5,677,925 | $ 823,695 | $ (56,119) | $ 12,721,651 |
| 43 | Budgetary Fund Balance at Beginning of Year | $ 21,510,276 | $ 11,676,679 | $ 2,405,127 | $ 367,849 | $ 25,400,988 | $ 24,043,848 | $ (57,424) | $ 85,347,343 |
| 44 | Budgetary Fund Balance at End of Year | $ 27,120,523 | $ 12,140,335 | $ 2,794,526 | $ 180,697 | $ 31,078,913 | $ 24,867,543 | $ (113,543) | $ 98,068,994 |
| 45 | SOURCE: Office of the Comptroller | ||||||||